Solution Download
Console Health.zip (44.9 KB)
Summary
NAA (NEA) does not currently have the ability for administrators of the application to easily view or alert on the health of the key collection jobs running on a recurring basis.
Issue
NAA is a very powerful tool that can do a great many things. This is wonderful in theory but inevitably makes the life of an administrator of the tool quite a lot harder to manage the health of all those great many things.
The current product requires an admin to open a multitude of job groups, digging around countless locations to finally isolate the job they wanted to quickly be able to view the current health on. They then need to do this for every other job that is scheduled to run across all the different Solution sets which can be incredibly tedious and easy to forget checking some key jobs. Even if the administrator were to finally find and view the state of one of the key collection jobs when deciding to peek after a few days, they might notice the job had been failing every day since the last time they checked it. This delay might cause a loss of data or time wasted due to not being properly alerted to the job failing. There are plans by the product team to introduce a fully baked admin dashboard to the product one day, but currently there is nothing of the sort and no ETA of when that might be worked on or released (at least as far as I’m aware of).

Instructions
The solution is the Console Health job group which contains two jobs meant to allow for alerting an admin on any errors occurring to key solution collection jobs, and to provide an easy to view dashboard of any key jobs’ most recent status. The alerting job can be tuned to exclude any error messages that are not needed for alerting on, and the dashboard allows for the addition of any other jobs an admin might want visibility on.

Collection_Alerting job
The Collection_Alerting job within the group will automatically look for all collection jobs for each existing Solution and surface errors if any occurred on recent runs of those jobs.

The ability exists to check for both error and warning messages on collection jobs if desired (not really recommended due to amount of noise) by clicking on the appropriate configuration blue box and updating value to 0.

Retention settings for the historical table that contains every message that is surfaced by the Collection_Alerting job can be modified under the previous configuration box.

Some messages might be noise events not needed for alerting every time a new similar type occurs on a collection jobs. To exclude a message, click on the appropriate configuration blue box to the right of the relevant mentioned solution containing the jobs having the errors/warnings.


Enter part of the message that is desired to be excluded. If any messages are found containing what is entered, then the full message will be excluded going forward for alerting.


The reports are not configured to be sent via email by default.
Method 1
Recommended to configure email functionality at the job group settings level (emails can sent to multiple email addresses separated by a semicolon (;)).

Be sure to check the Do Not Email Report If Blank checkbox! This will ensure if job runs and finds no messages to alert on then it will not send a blank report via email. Also, remember to hit Save on the bottom right once configuring the required email addresses to receive the alerts.
Method 2
Configure by individual report if not all collection jobs are desired to be alerted on.


Select Use default setting and click on Email this report from the dropdown list.

Enter the email address to send alert email to (email can sent to multiple email addresses separated by a semicolon (;)).
Remember to check the Do not e-mail this report if it is blank checkbox like in previous method and then click on Widgets step on the top left once email addresses are configured as desired.


Recommended not configuring the Historical Alert Messages report to be sent via email. That report will generally never be blank, so it would just flood the team with an email every day. The report can be viewed to see a full view of all captured messages since running the Collection_Alerting job.


Collection_Dashboard job
The Collection_Dashboard job allows an admin to quickly view the current state of all key jobs being utilized in the product.

The job is pre-configured to check the health of all out-the-box solution collection jobs. If other jobs are desired to be included on the dashboard, then click on the blue configuration box while the job is selected.


Double click on New Value in each column for the new added row to modify the entry to include the Solution name the job is found under (custom name can be used) and the exact job name as it appears in the job tree.


Next, a modification needs to be made to the query on the Collection_Dashboard job. This query is utilized to identify the current configured log level of all target jobs.
Open the Collection_Dashboard job group in file explorer by right clicking on the job name in the job tree and selecting Explore Folder from the list.

Hold shift and right click on the targetjobs.csv in the folder, then select Copy as path from the list.

Expand Configure on the job in the job tree.

Select Queries.

Double click on the blue highlighted bar in the middle UI.

Click on Configure in the top right.

Select either Next at the bottom right or Edit query at the top left to get to the next page.

Highlight the quotes and everything to the right of the $csvFile variable near the top and paste the correct targetjobs.csv file path that was copied previously.

Highlight the correct Jobs folder path in the updated $csvFile variable path and copy it.

Highlight the path in between the quotes to the right of the $startDir variable at the top and paste the path copied previously.

Some install directories of the product, as well as placement of the Console Health job group, might be different than how the paths are configured by default. This is the reason updating these for your specific environment is key.
Important: If the Console Health job group ever gets moved after initial configuration to a new location, be sure to go back and update the $csvFile variable with the new file path in the Collection_Dashboard job’s query.
Select Sample server step near the top left.

Select Finish in the bottom right.

Select OK to lock in and save the changes made to the query.

The Console Health job group should be scheduled to run at least Daily but can be run even more frequently if desired. Ensure the configured account running jobs via schedule has local admin rights to localhost and dbowner and dbo schema to NAA database to prevent any issues with running PowerShell script on job and writing collected data to the database.


It’s recommended setting the time for when an admin would be starting their workday to prevent any excessive emails after work hours.


The steps above might be slightly different in newer versions of product, but the configuration options should be similar.
After the Collection_Dashboard job is run, the Collection Dashboard report will provide an easy view of the current health of the key jobs running in the environment.

Interact with the dashboard by selecting the specific Solution in which the jobs are included to check the health on. It is quite easy to just quickly click through each Solution to see if any concerning Status stands out.

Once the desired Solution is selected, then the Job, Status, JobLocation, Start Time, End Time, and LogLevel columns become available to view.
The Job column identifies the name of the jobs found that exist under the specified Solution that have at least been run once before in the environment.

If the 1-FSAA System Scans job name was configured to be included in the dashboard (which it is by default), then the report will also show any job names that include that job name (i.e. 1-FSAA System Scans1). Sometimes you might have copied certain collection jobs to target different hosts, so this ensures the ability to have visibility in all those jobs as well.
Jobs that were previously ran but no longer exist might show on the report. These can easily be identified if they are showing a null JobLocation, meaning the dashboard job was unable to find the job in the Jobs directory.

If older jobs are showing that are no longer being utilized, then these can be filtered out by configuring the Collection Dashboard report.
Copy the job name that needs to be excluded from the Health Dashboard widget by left clicking on the name once, then right clicking, and selecting Copy Cell Data.

Select the Collection_Dashboard job name from the job tree list on the left.

Select Configure next to the Collection Dashboard report in the middle UI.

Select the Widgets step on the top left.

Select Configure.

Select Filter Editor near the middle.

Select Solution and then Job from the dropdown list.

Select Begins with and then Does not equal from the dropdown list.

Select and then paste in the previously copied job name, then click on OK a couple times near the bottom.


Then be sure to click on Finish near the bottom right to save the changes.

Regenerate the report by clicking on the three dots ![]() to the right of the Configure button.
to the right of the Configure button.

Select Generate from the list.

You will see a job in job queue message appear or increase in count after generating the report this way.

Once the message switches back to Job engine and host management are idle then that means the report has successfully regenerated. Usually generating a report should take a matter of seconds.

The Status column will check a job’s most recent run to see if any errors or warnings were found.

If both errors and warnings were found, then it will show the Status as ERROR. This means the job’s recent run might also contain warnings but highlights the fact that errors were found as well that need to be looked at.
If only warnings were found, then the Status shows as WARNING.
If there were no warnings or errors found on the previous run, then it marks it as SUCCESS.
If a job is currently running in the environment, then it will have a Start Time we can identify, but no End Time yet since it hasn’t finished. In this case it marks the job’s Status as RUNNING.

However, occasionally a job might have been abruptly stopped causing the End Time for that run to not get captured. In this case, the report would still show the Status as RUNNING. It would be a good idea to check the Running Instances to confirm that the job we are showing as RUNNING is actually running.


You might have other jobs running when checking the Running Instances but verify if the job running is the one found in the report or different.

If you’ve confirmed the job isn’t running anymore, find the job in the question in the job tree, right click on it, and select Explore Folder.

Look for a running.lck file in the folder and if found right click on it and attempt to delete it.

If it shows you the following File In Use message, this means there is a background process still running that needs to be forcefully ended.

Open Task Manager by right clicking on the Windows task bar near the bottom and selecting it from the list.

On the Processes tab, right click on the Name header and check the Command line option if currently unchecked.

Scroll down under Background processes until a StealthAUDIT (32 bit) process is found. There might be multiple, so be cautious to not end the wrong one. The Command line column will highlight the job that is running in both a StealthAUDIT (32 bit) and StealthAUDIT Wrapper (32 bit) process (i.e. the 1-SEEK System Scans job in the following screenshot).

If any StealthAUDIT background process still exists by itself without one or the other, then that is the key hung process that needs to be ended.

Right click on the process and select End task.

You should then be able to go back to the folder and delete the running.lck file.


This will not change how the report shows the job’s Status until that job is run again and completes (showing and End Time). It will continue showing as RUNNING until then, but this will ensure there are no issues with any lingering running.lck files that might disrupt future runs.
The JobLocation column shows the exact group the job is located within.

The Start Time column shows the date/time (based on app servers time zone) of when the most recent run of a job began.

This can help to determine if an expected job has not started for a long time outside of expected frequency. The Start Time can also be sorted (along with all other column headers) by clicking on the header name to see the most recently started jobs in a Solution. Click once to sort ascending or twice to sort descending.

The End Time column shows the date/time (based on app servers time zone) of when the most recent run of a job ended.

The LogLevel column shows the current configured log level on a job (ERROR/WARNING/INFO/DEBUG with DEBUG being the most verbose log level and ERROR being the least).

The GLOBAL log level is shown when a job is set to inherit the global application setting’s log level instead of having inheritance broken specifying a different log level. Recommended that all should be GLOBAL log level unless troubleshooting a specific error on a job in which case DEBUG log level would be appropriate.
Go to the global settings under Application to see what the current GLOBAL log level is set at.

If a job needs to be switched back to using inherited log level, navigate to the job, right click and select Properties.


Select OK to save the changes.

If there is a need to view the identified ERROR or WARNING messages from a job’s recent run, copy the job name from the Health Dashboard widget by left clicking on the name once, then right clicking, and selecting Copy Cell Data.

Scroll down on the report to the Message Details widget and select the funnel icon which will bring up an empty field below each column header.

Select in the field under the JobName header and paste in the previously copied job name.

This will show only the recent run’s messages for that job. If results show both warnings and errors for a job but only error messages are desired to be seen, then select in the field under the MSG_TYPE column header and type in error to only show error messages.

If certain error messages are flooding the report and are not desired to be seen due to the admin already being aware of them, they can be filtered out by configuring the Collection Dashboard report.
Select the Collection_Dashboard job name from the job tree list on the left.

Select Configure next to the Collection Dashboard report in the middle UI.
Select the Widgets step on the top left.
Select the Bottom location and then click on Configure.

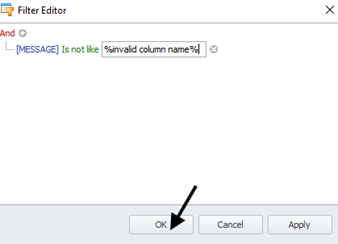
Select Filter Editor near the middle.

Select Job Name and then MESSAGE from the dropdown list.

Select Begins with and then Is not like from the dropdown list.

Select and then type in the part of the message you want excluded with percent signs before and after the message, then click on OK a couple times near the bottom.

Then be sure to click on Finish near the bottom right to save the changes.

Regenerate the report by clicking on the three dots ![]() to the right of the Configure button.
to the right of the Configure button.
Select Generate from the list.
The Collection_Dashboard job can be run interactively to get a current snapshot of the health of all the key jobs whenever desired.

Enable your system admins with these tools to help them maintain this incredibly useful product in your environment!